Intel Core i9-14900KS Review: The Swan Song of Raptor Lake With A Super Fast 6.2 GHz Turbo
by Gavin Bonshor on May 10, 2024 10:30 AM ESTCPU Benchmark Performance: Rendering
Rendering tests, compared to others, are often a little more simple to digest and automate. All the tests put out some sort of score or time, usually in an obtainable way that makes it fairly easy to extract. These tests are some of the most strenuous in our list, due to the highly threaded nature of rendering and ray-tracing, and can draw a lot of power.
If a system is not properly configured to deal with the thermal requirements of the processor, the rendering benchmarks are where it would show most easily as the frequency drops over a sustained period of time. Most benchmarks, in this case, are re-run several times, and the key to this is having an appropriate idle/wait time between benchmarks to allow for temperatures to normalize from the last test.
Some of the notable rendering-focused benchmarks we've included for 2024 include the latest CineBench 2024 benchmark and an update to Blender 3.6 and V-Ray 5.0.2.
We are using DDR5 memory on the Core i9-14900KS, as well as the other Intel 14th Gen Core series processors including the Core i9-14900K, the Core i7-14700K, Core i5-14600K, and Intel's 13th Gen at the relative JEDEC settings. The same methodology is also used for the AMD Ryzen 7000 series and Intel's 12th Gen (Alder Lake) processors. Below are the settings we have used for each platform:
- DDR5-5600B CL46 - Intel 14th & 13th Gen
- DDR5-5200 CL44 - Ryzen 7000
- DDR5-4800 (B) CL40 - Intel 12th Gen
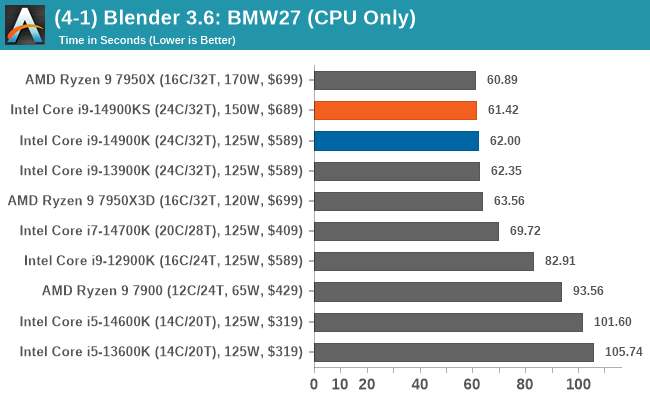
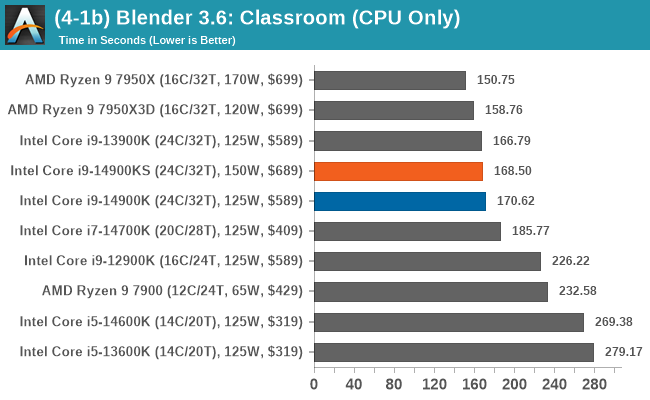
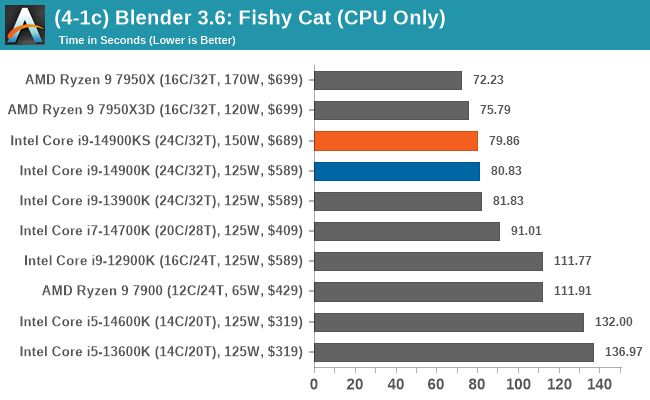
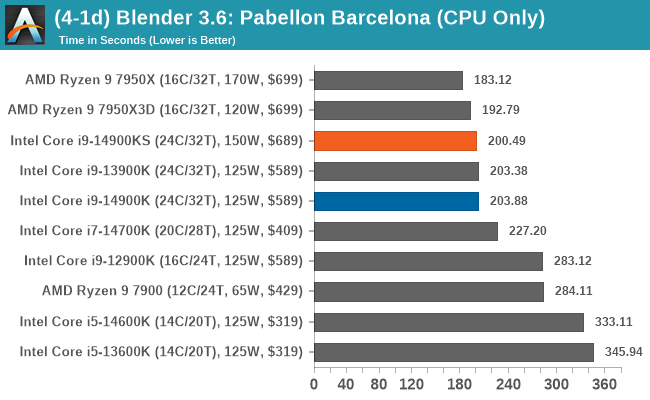
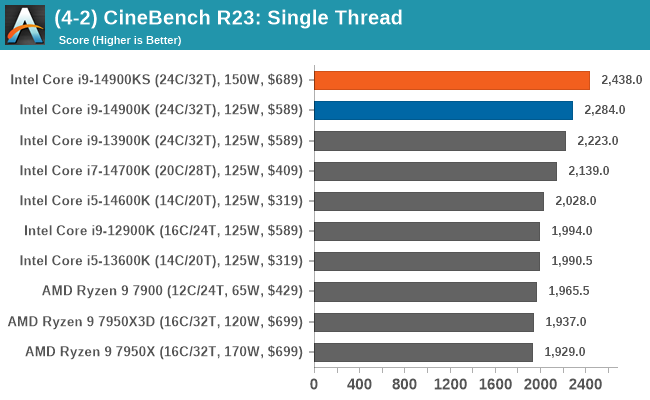
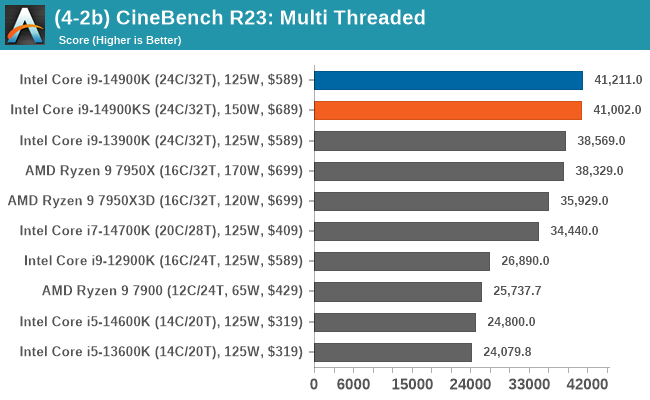
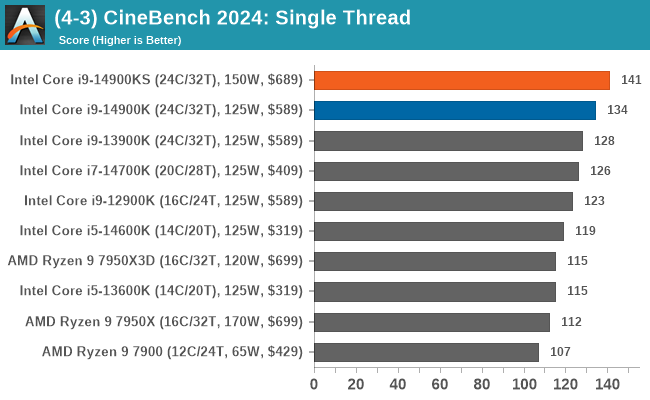
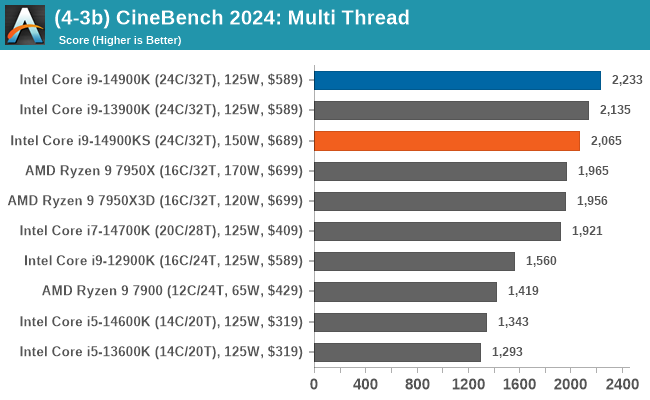
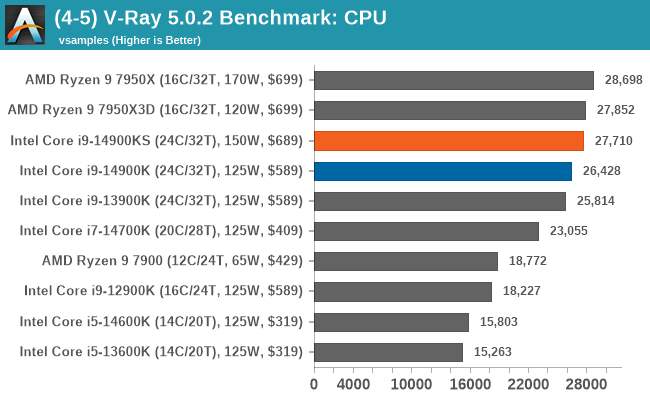
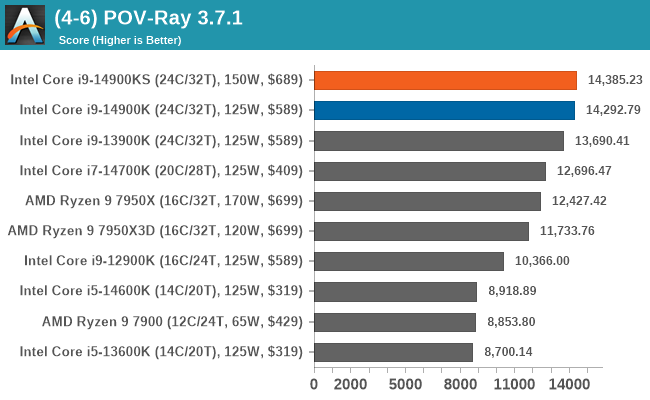
Rendering workloads are highly intensive and, for the most part, are more intensive than other typical workloads. As we can see in both the CineBench R23 and 2024 single-threaded results, the additional 200 MHz to the P-core turbo (6.2 GHz) makes a notable difference to ST performance. In contrast, in the multi-threaded tests, again, we don't see too much difference in benchmarks such as Blender, where the extra clock speed saves a couple of seconds at most over a long benchmark.


54 Comments
View All Comments
PeachNCream - Tuesday, May 14, 2024 - link
They take a light approach to comment removal. Things would have to devolve into petty squabbling or delve into topics like AT's loss of web traffic or credibility so its not like they censor with a heavy hand. It's just to protect Future LLC's financial interests and how it appears to readers. Calm down please. ReplyOxford Guy - Thursday, May 16, 2024 - link
Are you an employee? Replynandnandnand - Friday, May 10, 2024 - link
Instable means unstable?! NoooOOOoo! Replyerotomania - Friday, May 10, 2024 - link
Suffering instability while being unstable...yikes Replyerotomania - Friday, May 10, 2024 - link
Thanks Gavin. Enjoyable read. Pretty steep CPU+cooler investment, considering a $20ish Thermalright air cooler can cool an i5-14600K just fine.Autocorrect may have nipped this phrase: "...decide the IHS from the chip..." Reply
Gavin Bonshor - Friday, May 10, 2024 - link
I appreciate your comment.Also, thank you for spotting that. My apologies! It has now been fixed :) Reply
NextGen_Gamer - Friday, May 10, 2024 - link
I would so love for Anandtech to do another of their IPC-focused articles at this moment between AMD and Intel. Take the Core i9 14900K (or KS, don't matter), disable all the E-cores, and set all the P-cores at the same 4.0GHz. From AMD, use both the Ryzen 7 7800X and 7800X3D, and do the same: set all cores to 4.0GHz. Then take those three setups (Zen 4, Zen 4+X3D, Raptor Lake Refresh) through the full benchmark runs. Everyone on the same amount of cores, same frequency. ReplyHulk - Friday, May 10, 2024 - link
Can we see the v/f curve from the VID of the chip you have for testing?Specifically what are the VID voltages at 6.2 and 5.9? At 6.2 they can vary from just below 1.4V (golden sample) to over 1.5V (really bad). Reply
HideOut - Friday, May 10, 2024 - link
Why is it Anandtech is posting reviews of a CPU thats been out a while now... ReplyThunder 57 - Friday, May 10, 2024 - link
They probably finally got enough ad revenue to buy one since no one samples them anything anymore it seems. Reply